
"If we don't have it, we don't need it," pronounces Daniel Fagre as we throw on our backpacks. We're armed with crampons, ice axes, rope, GPS receivers, and bear spray to ward off grizzlies, and we're trudging toward Sperry Glacier in Glacier National Park, Montana. I fall in step with Fagre and two other research scientists from the U.S. Geological Survey Global Change Research Program.
They're doing what they've been doing for more than a decade: measuring how the park's storied glaciers are melting.
So far, the results have been positively chilling. When President Taft created Glacier National Park in 1910, it was home to an estimated 150 glaciers. Since then the number has decreased to fewer than 30, and most of those remaining have shrunk in area by two-thirds. Fagre predicts that within 30 years most if not all of the park's namesake glaciers will disappear.
"Things that normally happen in geologic time are happening during the span of a human lifetime," says Fagre. "It's like watching the Statue of Liberty melt."
Scientists who assess the planet's health see indisputable evidence that Earth has been getting warmer, in some cases rapidly. Most believe that human activity, in particular the burning of fossil fuels and the resulting buildup of greenhouse gases in the atmosphere, have influenced this warming trend. In the past decade scientists have documented record-high average annual surface temperatures and have been observing other signs of change all over the planet: in the distribution of ice, and in the salinity, levels, and temperatures of the oceans.
"This glacier used to be closer," Fagre declares as we crest a steep section, his glasses fogged from exertion. He's only half joking. A trailside sign notes that since 1901, Sperry Glacier has shrunk from more than 800 acres to 300 acres. "That's out of date," Fagre says, stopping to catch his breath. "It's now less than 250 acres."
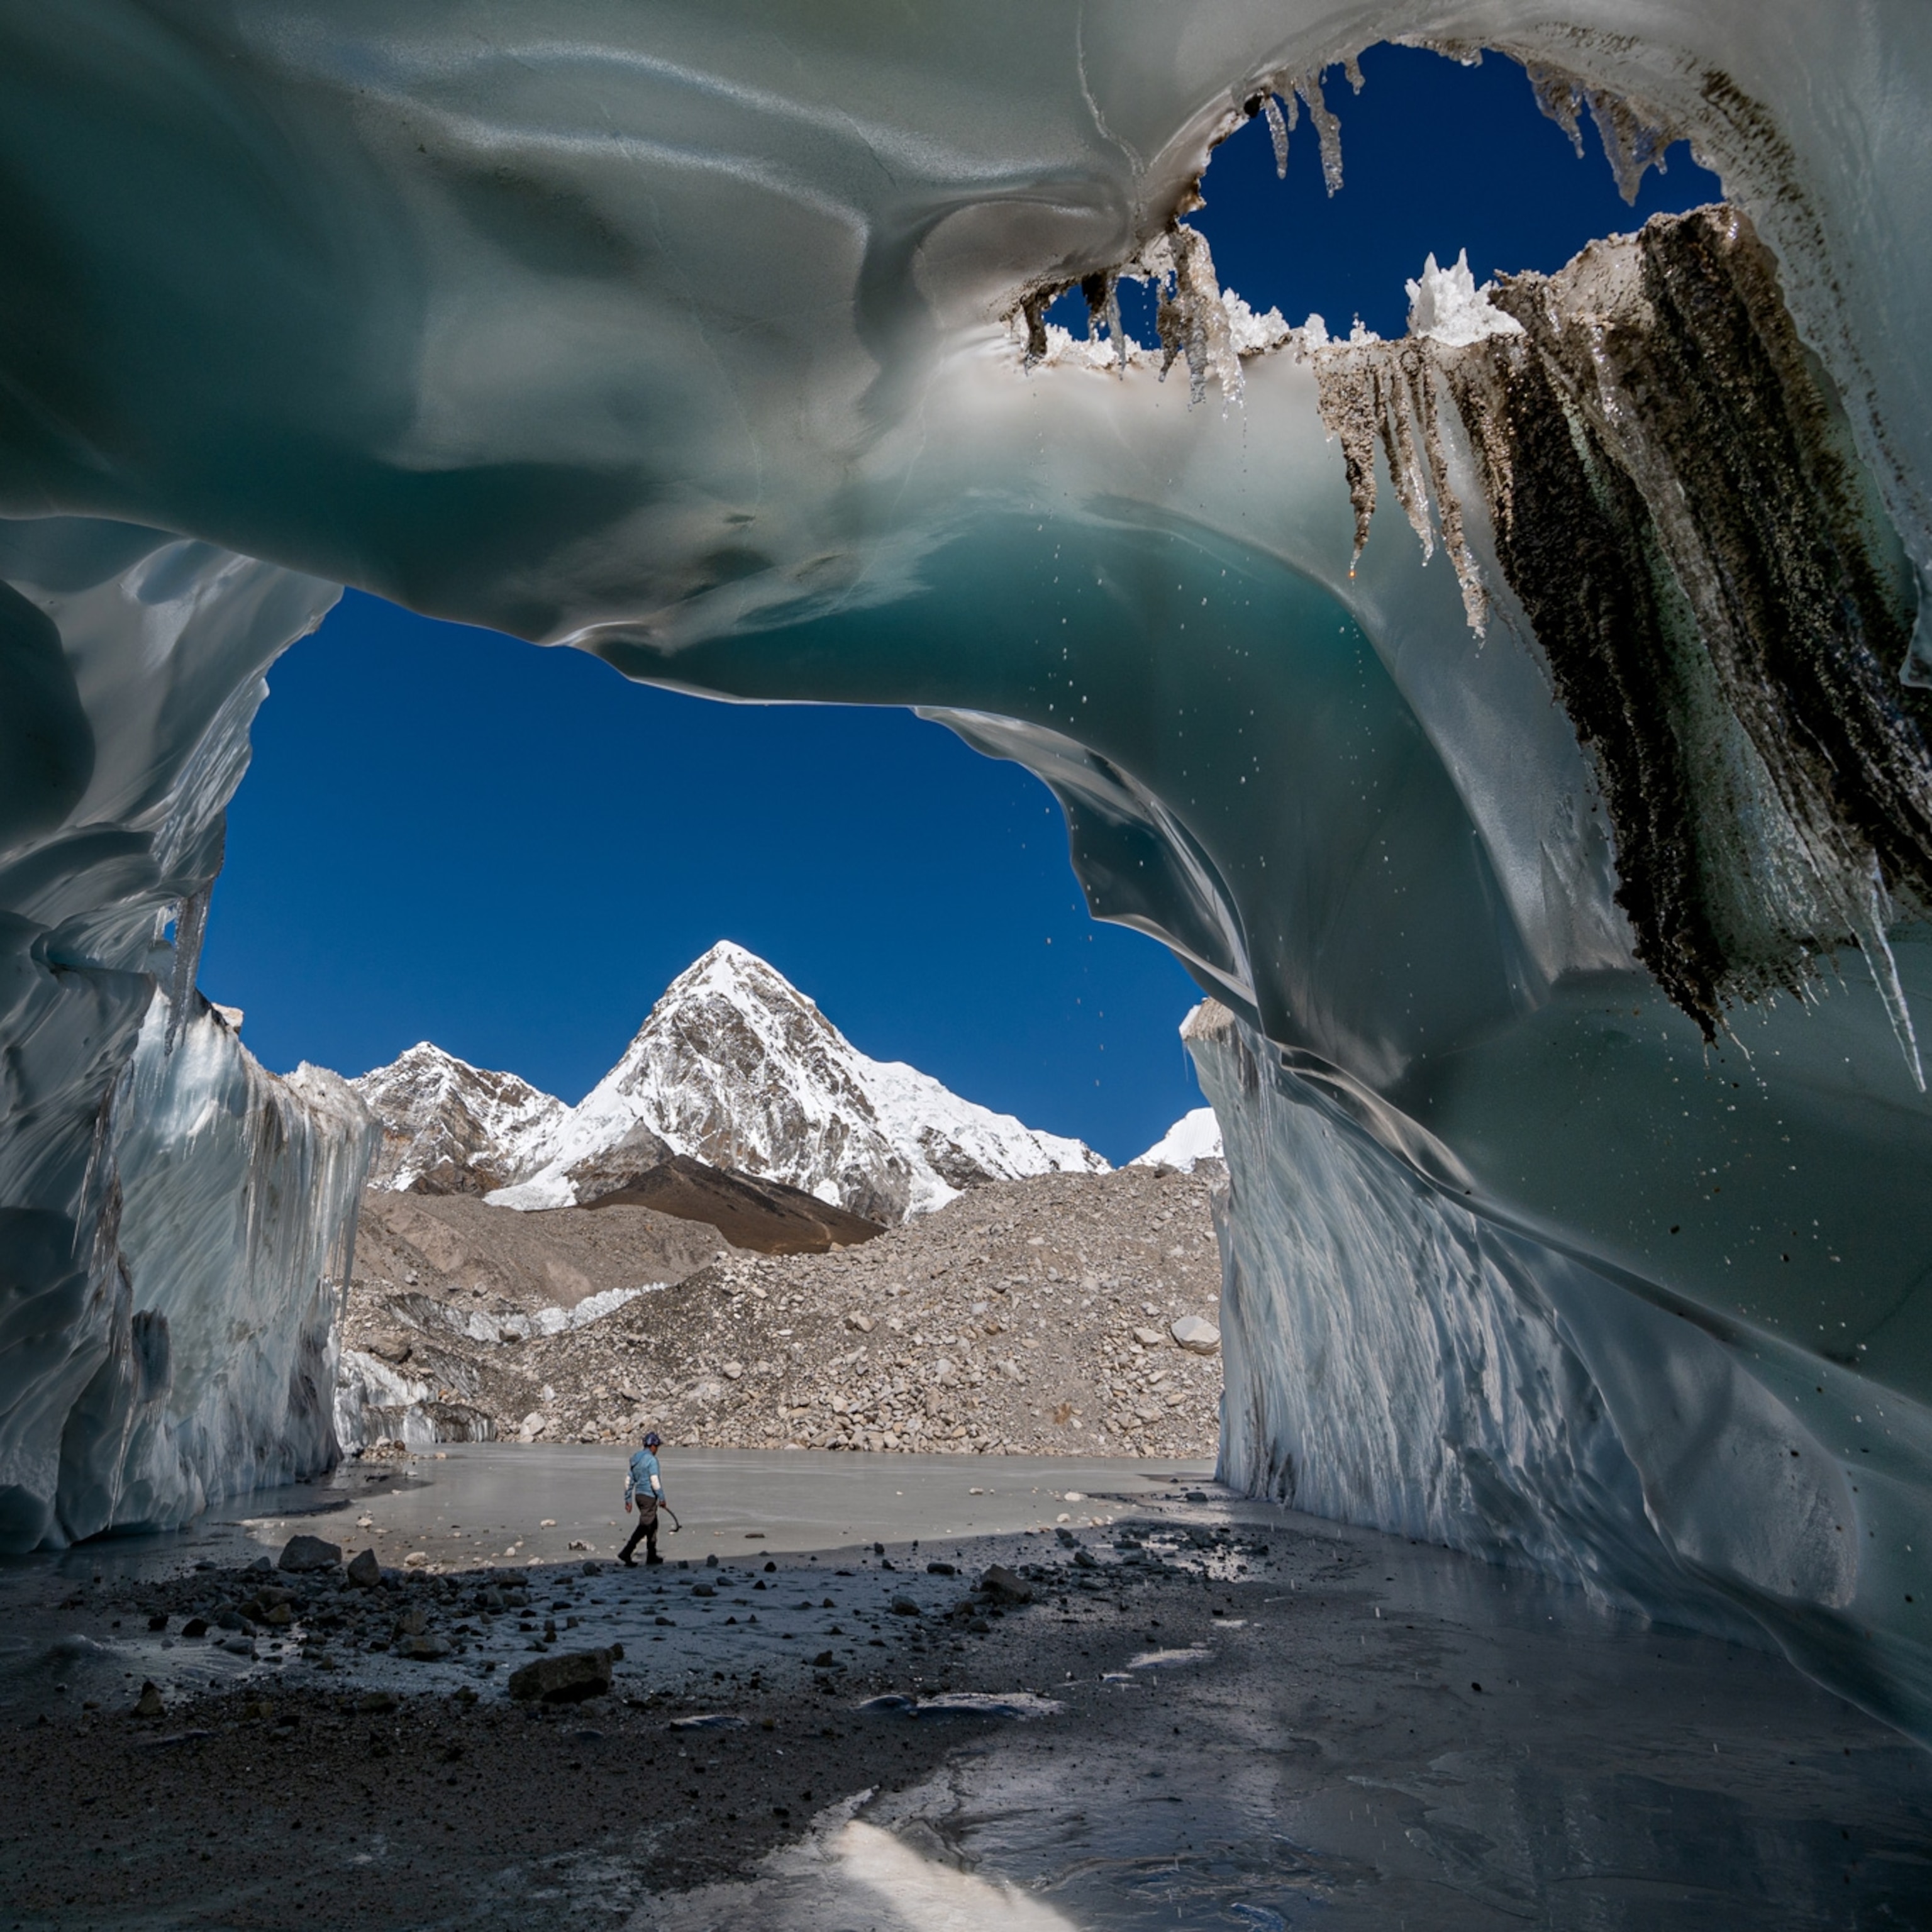
Everywhere on Earth ice is changing. The famed snows of Kilimanjaro have melted more than 80 percent since 1912. Glaciers in the Garhwal Himalaya in India are retreating so fast that researchers believe that most central and eastern Himalayan glaciers could virtually disappear by 2035. Arctic sea ice has thinned significantly over the past half century, and its extent has declined by about 10 percent in the past 30 years. NASA's repeated laser altimeter readings show the edges of Greenland's ice sheet shrinking. Spring freshwater ice breakup in the Northern Hemisphere now occurs nine days earlier than it did 150 years ago, and autumn freezeup ten days later. Thawing permafrost has caused the ground to subside more than 15 feet (4.6 meters) in parts of Alaska. From the Arctic to Peru, from Switzerland to the equatorial glaciers of Irian Jaya in Indonesia, massive ice fields, monstrous glaciers, and sea ice are disappearing, fast.
When temperatures rise and ice melts, more water flows to the seas from glaciers and ice caps, and ocean water warms and expands in volume. This combination of effects has played the major role in raising average global sea level between four and eight inches (10.2 and 20.3 centimeters) in the past hundred years, according to the Intergovernmental Panel on Climate Change (IPCC).
Scientists point out that sea levels have risen and fallen substantially over Earth's 4.6-billion year history. But the recent rate of global sea level rise has departed from the average rate of the past two to three thousand years and is rising more rapidly—about one-tenth of an inch (0.25 centimeters) a year. A continuation or acceleration of that trend has the potential to cause striking changes in the world's coastlines.
Driving around Louisiana's Gulf Coast, Windell Curole can see the future, and it looks pretty wet. In southern Louisiana coasts are literally sinking by about three feet (0.91 meters) a century, a process called subsidence. A sinking coastline and a rising ocean combine to yield powerful effects. It's like taking the global sea-level-rise problem and moving it along at fast-forward.
The seventh-generation Cajun and manager of the South Lafourche Levee District navigates his truck down an unpaved mound of dirt that separates civilization from inundation, dry land from a swampy horizon. With his French-tinged lilt, Curole points to places where these bayous, swamps, and fishing villages portend a warmer world: his high school girlfriend's house partly submerged, a cemetery with water lapping against the white tombs, his grandfather's former hunting camp now afloat in a stand of skeleton oak snags. "We live in a place of almost land, almost water," says the 52-year-old Curole.
Rising sea level, sinking land, eroding coasts, and temperamental storms are a fact of life for Curole. Even relatively small storm surges in the past two decades have overwhelmed the system of dikes, levees, and pump stations that he manages, upgraded in the 1990s to forestall the Gulf of Mexico's relentless creep. "I've probably ordered more evacuations than any other person in the country," Curole says.
The current trend is consequential not only in coastal Louisiana but around the world. Never before have so many humans lived so close to the coasts: More than a hundred million people worldwide live within three feet (0.91 meters) of mean sea level. Vulnerable to sea-level rise, Tuvalu, a small country in the South Pacific, has already begun formulating evacuation plans. Megacities where human populations have concentrated near coastal plains or river deltas—Shanghai, Bangkok, Jakarta, Tokyo, and New York—are at risk. The projected economic and humanitarian impacts on low-lying, densely populated, and desperately poor countries like Bangladesh are potentially catastrophic. The scenarios are disturbing even in wealthy countries like the Netherlands, with nearly half its landmass already at or below sea level.
Rising sea level produces a cascade of effects. Bruce Douglas, a coastal researcher at Florida International University, calculates that every inch (2.5 centimeters) of sea-level rise could result in eight feet (2.4 meters) of horizontal retreat of sandy beach shorelines due to erosion. Furthermore, when salt water intrudes into freshwater aquifers, it threatens sources of drinking water and makes raising crops problematic. In the Nile Delta, where many of Egypt's crops are cultivated, widespread erosion and saltwater intrusion would be disastrous—since the country contains little other arable land.
In some places marvels of human engineering worsen effects from rising seas in a warming world. The system of channels and levees along the Mississippi effectively stopped the millennia-old natural process of rebuilding the river delta with rich sediment deposits. In the 1930s, oil and gas companies began to dredge shipping and exploratory canals, tearing up the marshland buffers that helped dissipate tidal surges. Energy drilling removed vast quantities of subsurface liquid, which studies suggest increased the rate at which the land is sinking. Now Louisiana is losing approximately 25 square miles (64.8 square kilometers) of wetlands every year, and the state is lobbying for federal money to help replace the upstream sediments that are the delta's lifeblood.
Local projects like that might not do much good in the very long run, though, depending on the course of change elsewhere on the planet. Part of Antarctica's Larsen Ice Shelf broke apart in early 2002. Although floating ice does not change sea level when it melts (any more than a glass of water will overflow when the ice cubes in it melt), scientists became concerned that the collapse could foreshadow the breakup of other ice shelves in Antarctica and allow increased glacial discharge into the sea from ice sheets on the continent. If the West Antarctic ice sheet were to break up, which scientists consider very unlikely this century, it alone contains enough ice to raise sea level by nearly 20 feet (6.1 meters).
Even without such a major event, the IPCC projected in its 2001 report that sea level will rise anywhere between 4 and 35 inches (10.2 and 88.9 centimeters) by the end of the century. The high end of that projection—nearly three feet (0.91 meters)—would be "an unmitigated disaster," according to Douglas.
Down on the bayou, all of those predictions make Windell Curole shudder. "We're the guinea pigs," he says, surveying his aqueous world from the relatively lofty vantage point of a 12-foot (3.7-meter) high earthen berm. "I don't think anybody down here looks at the sea-level-rise problem and puts their heads in the sand." That's because soon there may not be much sand left.
Rising sea level is not the only change Earth's oceans are undergoing. The ten-year-long World Ocean Circulation Experiment, launched in 1990, has helped researchers to better understand what is now called the ocean conveyor belt.
Oceans, in effect, mimic some functions of the human circulatory system. Just as arteries carry oxygenated blood from the heart to the extremities, and veins return blood to be replenished with oxygen, oceans provide life-sustaining circulation to the planet. Propelled mainly by prevailing winds and differences in water density, which changes with the temperature and salinity of the seawater, ocean currents are critical in cooling, warming, and watering the planet's terrestrial surfaces—and in transferring heat from the Equator to the Poles.


The engine running the conveyor belt is the density-driven thermohaline circulation ("thermo" for heat and "haline" for salt). Warm, salty water flows from the tropical Atlantic north toward the Pole in surface currents like the Gulf Stream. This saline water loses heat to the air as it is carried to the far reaches of the North Atlantic. The coldness and high salinity together make the water more dense, and it sinks deep into the ocean. Surface water moves in to replace it. The deep, cold water flows into the South Atlantic, Indian, and Pacific Oceans, eventually mixing again with warm water and rising back to the surface.
Changes in water temperature and salinity, depending on how drastic they are, might have considerable effects on the ocean conveyor belt. Ocean temperatures are rising in all ocean basins and at much deeper depths than previously thought, say scientists at the National Oceanic and Atmospheric Administration (NOAA). Arguably, the largest oceanic change ever measured in the era of modern instruments is in the declining salinity of the subpolar seas bordering the North Atlantic.
Robert Gagosian, president and director of the Woods Hole Oceanographic Institution, believes that oceans hold the key to potential dramatic shifts in the Earth's climate. He warns that too much change in ocean temperature and salinity could disrupt the North Atlantic thermohaline circulation enough to slow down or possibly halt the conveyor belt—causing drastic climate changes in time spans as short as a decade.
The future breakdown of the thermohaline circulation remains a disturbing, if remote, possibility. But the link between changing atmospheric chemistry and the changing oceans is indisputable, says Nicholas Bates, a principal investigator for the Bermuda Atlantic Time-series Study station, which monitors the temperature, chemical composition, and salinity of deep-ocean water in the Sargasso Sea southeast of the Bermuda Triangle.
Oceans are important sinks, or absorption centers, for carbon dioxide, and take up about a third of human-generated CO2. Data from the Bermuda monitoring programs show that CO2 levels at the ocean surface are rising at about the same rate as atmospheric CO2. But it is in the deeper levels where Bates has observed even greater change. In the waters between 250 and 450 meters (820 and 1,476 feet) deep, CO2 levels are rising at nearly twice the rate as in the surface waters. "It's not a belief system; it's an observable scientific fact," Bates says. "And it shouldn't be doing that unless something fundamental has changed in this part of the ocean."
While scientists like Bates monitor changes in the oceans, others evaluate CO2 levels in the atmosphere. In Vestmannaeyjar, Iceland, a lighthouse attendant opens a large silver suitcase that looks like something out of a James Bond movie, telescopes out an attached 15-foot (4.6-meter) rod, and flips a switch, activating a computer that controls several motors, valves, and stopcocks. Two two-and-a-half-liter (2.64-quart) flasks in the suitcase fill with ambient air. In North Africa, an Algerian monk at Assekrem does the same. Around the world, collectors like these are monitoring the cocoon of gases that compose our atmosphere and permit life as we know it to persist.
When the weekly collection is done, all the flasks are sent to Boulder, Colorado. There, Pieter Tans, a Dutch-born atmospheric scientist with NOAA's Climate Monitoring and Diagnostics Laboratory, oversees a slew of sensitive instruments that test the air in the flasks for its chemical composition. In this way Tans helps assess the state of the world's atmosphere.
By all accounts it has changed significantly in the past 150 years.
Walking through the various labs filled with cylinders of standardized gas mixtures, absolute manometers, and gas chromatographs, Tans offers up a short history of atmospheric monitoring. In the late 1950s a researcher named Charles Keeling began measuring CO2 in the atmosphere above Hawaii's 13,679-foot (4,169-meter) Mauna Loa. The first thing that caught Keeling's eye was how CO2 level rose and fell seasonally. That made sense since, during spring and summer, plants take in CO2 during photosynthesis and produce oxygen in the atmosphere. In the fall and winter, when plants decay, they release greater quantities of CO2 through respiration and decay. Keeling's vacillating seasonal curve became famous as a visual representation of the Earth "breathing."
Something else about the way the Earth was breathing attracted Keeling's attention. He watched as CO2 level not only fluctuated seasonally, but also rose year after year. Carbon dioxide level has climbed from about 315 parts per million (ppm) from Keeling's first readings in 1958 to more than 375 ppm today. A primary source for this rise is indisputable: humans' prodigious burning of carbon-laden fossil fuels for their factories, homes, and cars.
Tans shows me a graph depicting levels of three key greenhouse gases—CO2, methane, and nitrous oxide—from the year 1000 to the present. The three gases together help keep Earth, which would otherwise be an inhospitably cold orbiting rock, temperate by orchestrating an intricate dance between the radiation of heat from Earth back to space (cooling the planet) and the absorption of radiation in the atmosphere (trapping it near the surface and thus warming the planet).
Tans and most other scientists believe that greenhouse gases are at the root of our changing climate. "These gases are a climate-change driver," says Tans, poking his graph definitively with his index finger. The three lines on the graph follow almost identical patterns: basically flat until the mid-1800s, then all three move upward in a trend that turns even more sharply upward after 1950. "This is what we did," says Tans, pointing to the parallel spikes. "We have very significantly changed the atmospheric concentration of these gases. We know their radiative properties," he says. "It is inconceivable to me that the increase would not have a significant effect on climate."
Exactly how large that effect might be on the planet's health and respiratory system will continue to be a subject of great scientific and political debate—especially if the lines on the graph continue their upward trajectory.
Eugene Brower, an Inupiat Eskimo and president of the Barrow Whaling Captains' Association, doesn't need fancy parts-per-million measurements of CO2 concentrations or long-term sea-level gauges to tell him that his world is changing.
"It's happening as we speak," the 56-year-old Brower says as we drive around his home in Barrow, Alaska—the United States' northernmost city—on a late August day. In his fire chief's truck, Brower takes me to his family's traditional ice cellars, painstakingly dug into the permafrost, and points out how his stores of muktuk—whale skin and blubber—recently began spoiling in the fall because melting water drips down to his food stores. Our next stop is the old Bureau of Indian Affairs school building. The once impenetrable permafrost that kept the foundation solid has bucked and heaved so much that walking through the school is almost like walking down the halls of an amusement park fun house. We head to the eroding beach and gaze out over open water. "Normally by now the ice would be coming in," Brower says, scrunching up his eyes and scanning the blue horizon.
We continue our tour. Barrow looks like a coastal community under siege. The ramshackle conglomeration of weather-beaten houses along the seaside gravel road stands protected from fall storm surges by miles-long berms of gravel and mud that block views of migrating gray whales. Yellow bulldozers and graders patrol the coast like sentries.
The Inupiat language has words that describe many kinds of ice. Piqaluyak is salt-free multiyear sea ice. Ivuniq is a pressure ridge. Sarri is the word for pack ice, tuvaqtaq is bottom-fast ice, and shore-fast ice is tuvaq. For Brower, these words are the currency of hunters who must know and follow ice patterns to track bearded seals, walruses, and bowhead whales.
There are no words, though, to describe how much, and how fast, the ice is changing. Researchers long ago predicted that the most visible impacts from a globally warmer world would occur first at high latitudes: rising air and sea temperatures, earlier snowmelt, later ice freeze-up, reductions in sea ice, thawing permafrost, more erosion, increases in storm intensity. Now all those impacts have been documented in Alaska. "The changes observed here provide an early warning system for the rest of the planet," says Amanda Lynch, an Australian researcher who is the principal investigator on a project that works with Barrow's residents to help them incorporate scientific data into management decisions for the city's threatened infrastructure.
Before leaving the Arctic, I drive to Point Barrow alone. There, at the tip of Alaska, roughshod hunting shacks dot the spit of land that marks the dividing line between the Chukchi and Beaufort Seas. Next to one shack someone has planted three eight-foot (2.4-meter) sticks of white driftwood in the sand, then crisscrossed their tops with whale baleen, a horny substance that whales of the same name use to filter life-sustaining plankton out of seawater. The baleen, curiously, looks like palm fronds.
So there, on the North Slope of Alaska, stand three makeshift palm trees. Perhaps they are no more than an elaborate Inupiat joke, but these Arctic palms seem an enigmatic metaphor for the Earth's future.
Extras: See photos, field notes, and more from this National Geographic article.
Related Topics
You May Also Like


Go Further
Animals
- Soy, skim … spider. Are any of these technically milk?Soy, skim … spider. Are any of these technically milk?
- This pristine piece of the Amazon shows nature’s resilienceThis pristine piece of the Amazon shows nature’s resilience
- Octopuses have a lot of secrets. Can you guess 8 of them?
- Animals
- Feature
Octopuses have a lot of secrets. Can you guess 8 of them?
Environment
- This pristine piece of the Amazon shows nature’s resilienceThis pristine piece of the Amazon shows nature’s resilience
- Listen to 30 years of climate change transformed into haunting musicListen to 30 years of climate change transformed into haunting music
- This ancient society tried to stop El Niño—with child sacrificeThis ancient society tried to stop El Niño—with child sacrifice
- U.S. plans to clean its drinking water. What does that mean?U.S. plans to clean its drinking water. What does that mean?
History & Culture
- Gambling is everywhere now. When is that a problem?Gambling is everywhere now. When is that a problem?
- Beauty is pain—at least it was in 17th-century SpainBeauty is pain—at least it was in 17th-century Spain
- The real spies who inspired ‘The Ministry of Ungentlemanly Warfare’The real spies who inspired ‘The Ministry of Ungentlemanly Warfare’
- Heard of Zoroastrianism? The religion still has fervent followersHeard of Zoroastrianism? The religion still has fervent followers
- Strange clues in a Maya temple reveal a fiery political dramaStrange clues in a Maya temple reveal a fiery political drama
Science
- NASA has a plan to clean up space junk—but is going green enough?NASA has a plan to clean up space junk—but is going green enough?
- Soy, skim … spider. Are any of these technically milk?Soy, skim … spider. Are any of these technically milk?
- Can aspirin help protect against colorectal cancers?Can aspirin help protect against colorectal cancers?
- The unexpected health benefits of Ozempic and MounjaroThe unexpected health benefits of Ozempic and Mounjaro
- Do you have an inner monologue? Here’s what it reveals about you.Do you have an inner monologue? Here’s what it reveals about you.
Travel
- Follow in the footsteps of Robin Hood in Sherwood ForestFollow in the footsteps of Robin Hood in Sherwood Forest
- This chef is taking Indian cuisine in a bold new directionThis chef is taking Indian cuisine in a bold new direction
- On the path of Latin America's greatest wildlife migrationOn the path of Latin America's greatest wildlife migration
- Everything you need to know about Everglades National ParkEverything you need to know about Everglades National Park
